

1. What is htop?
htop is an interactive, colour‑enhanced alternative to the classic top command. It provides a real‑time view of system processes, CPU/memory usage, and load averages, while allowing mouse interaction and on‑the‑fly configuration changes.
Key benefits over top:
| Feature | top |
htop |
|---|---|---|
| Full‑screen, scrollable list | No (static) | Yes |
| Mouse support | No | Yes |
| Tree view of processes | No | Yes |
| Easy column selection | Hard (config file) | Interactive (F2) |
| Colour / bar graphs | Limited | Rich |
| Batch mode with CSV output | Yes (top -b) |
Yes (htop -b) |
| Customizable keybindings | No | Yes (via ~/.config/htop/htoprc) |
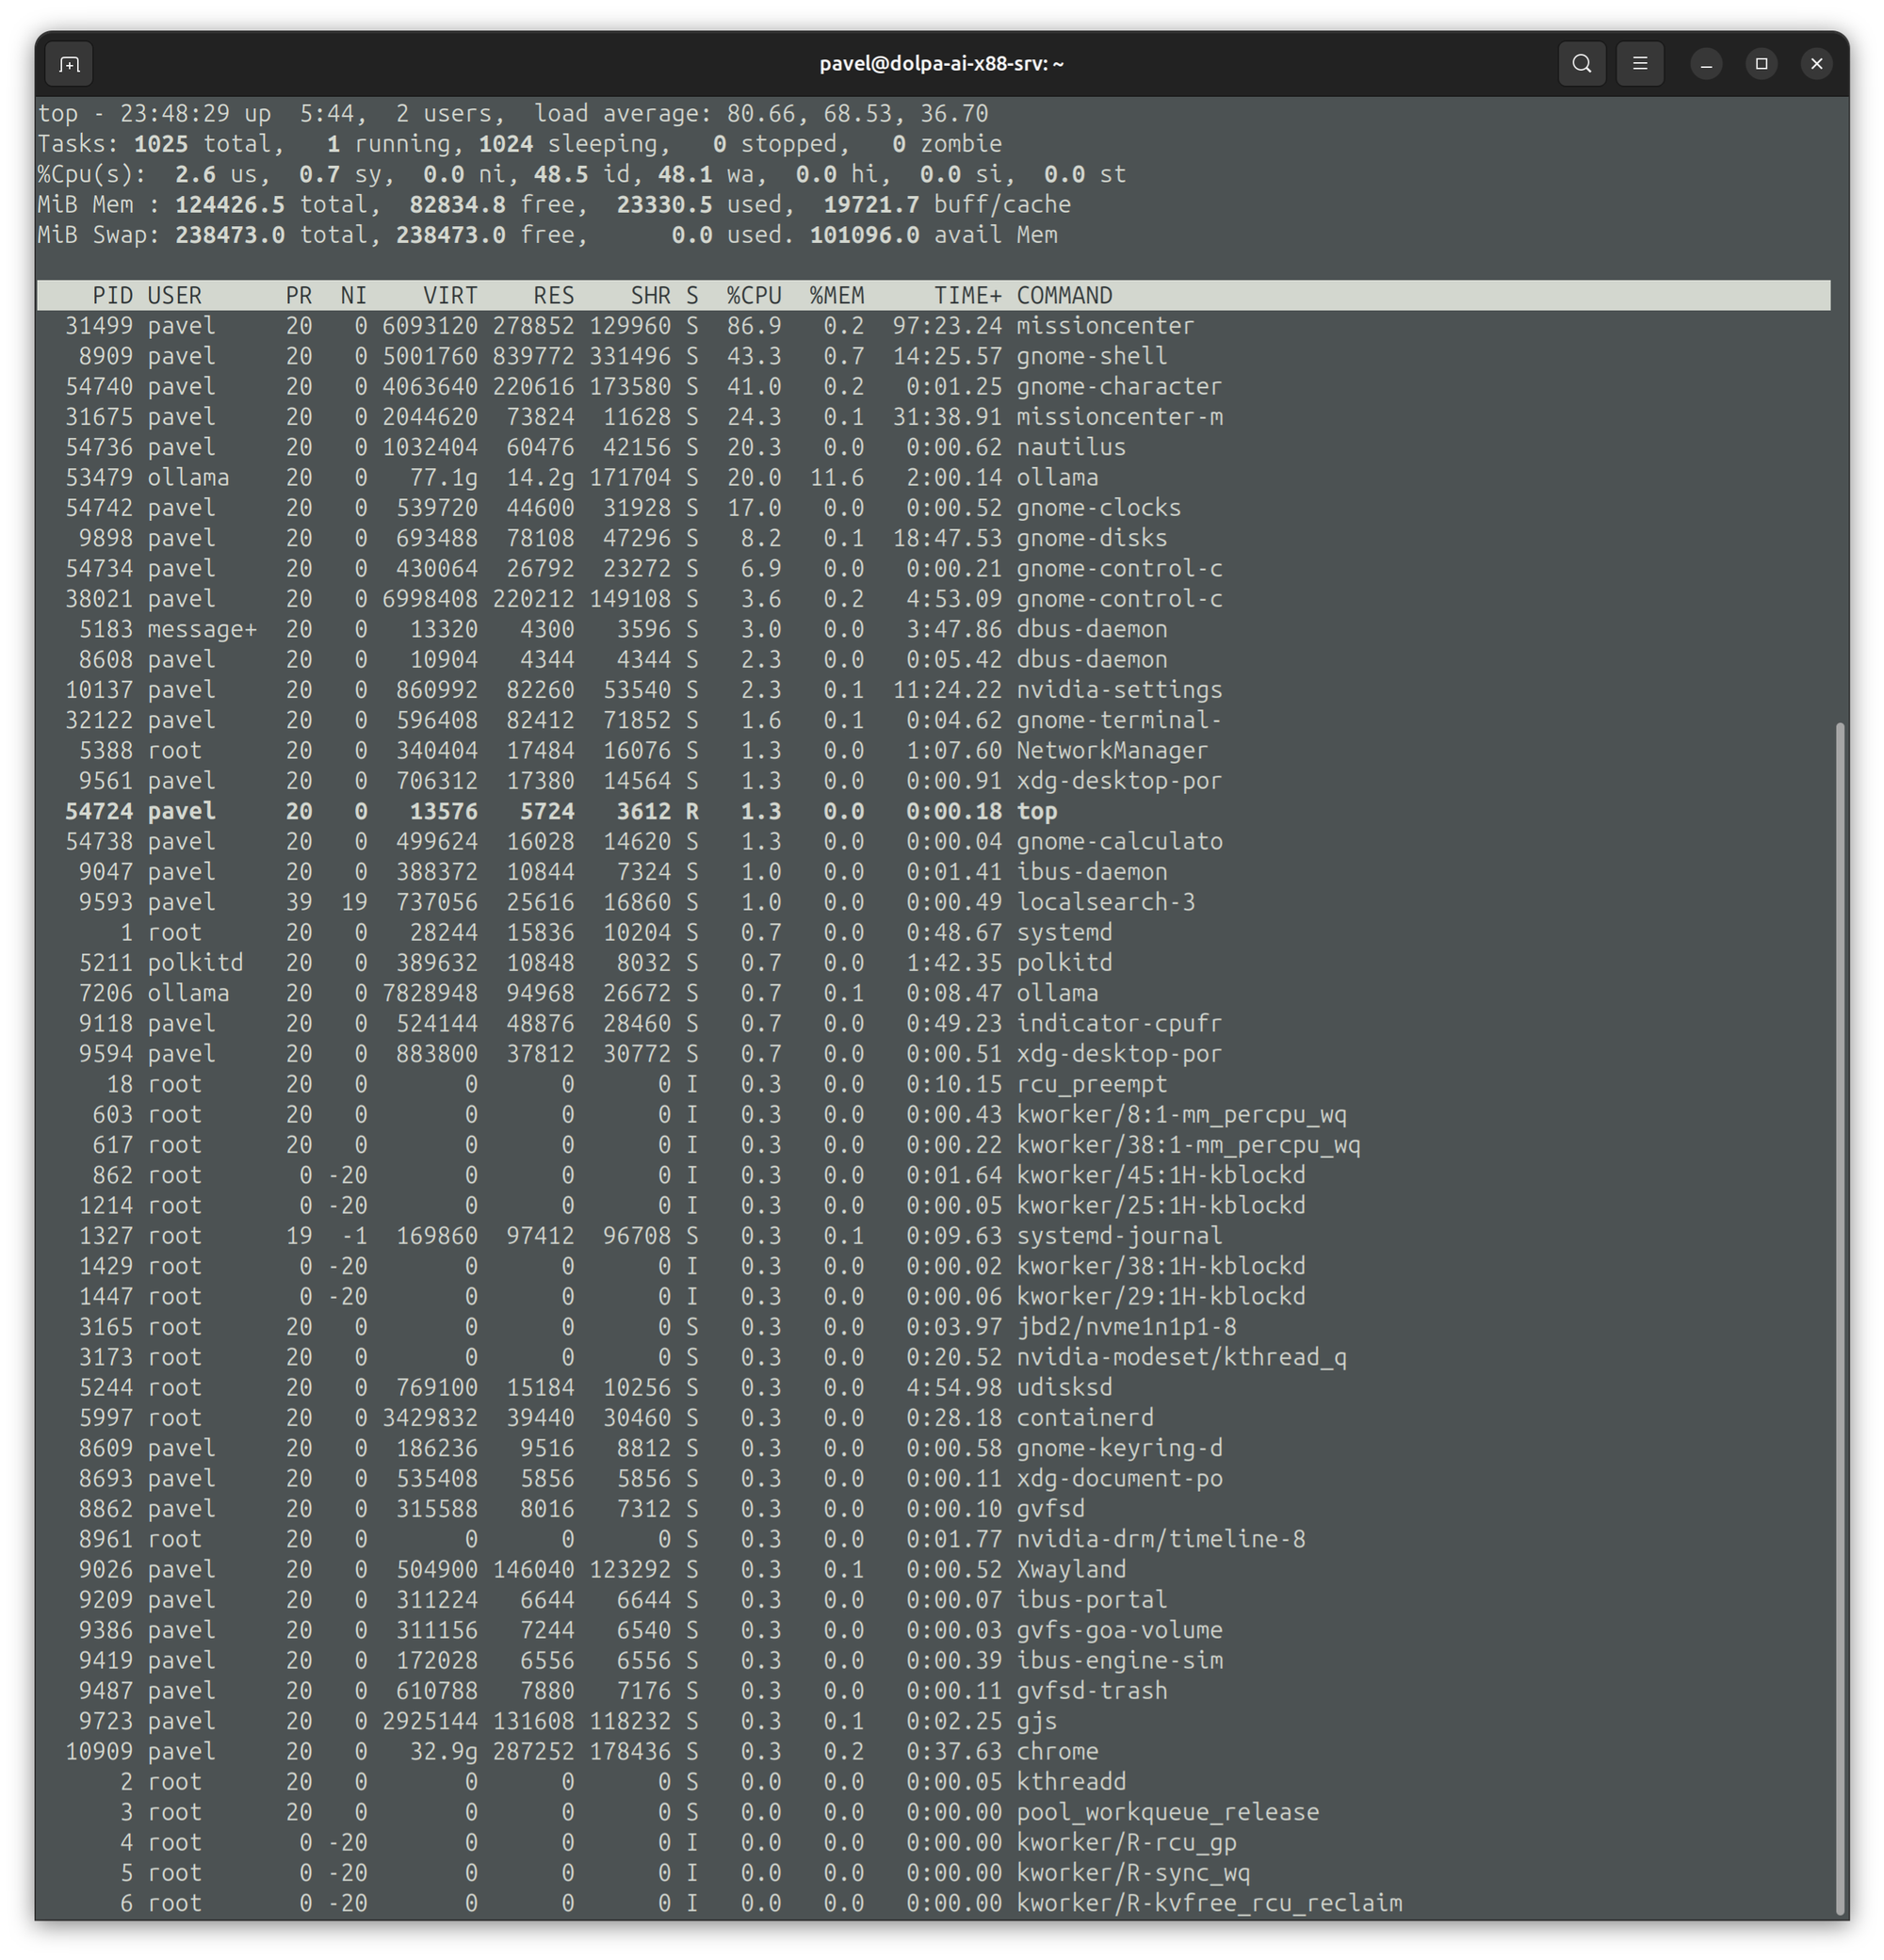
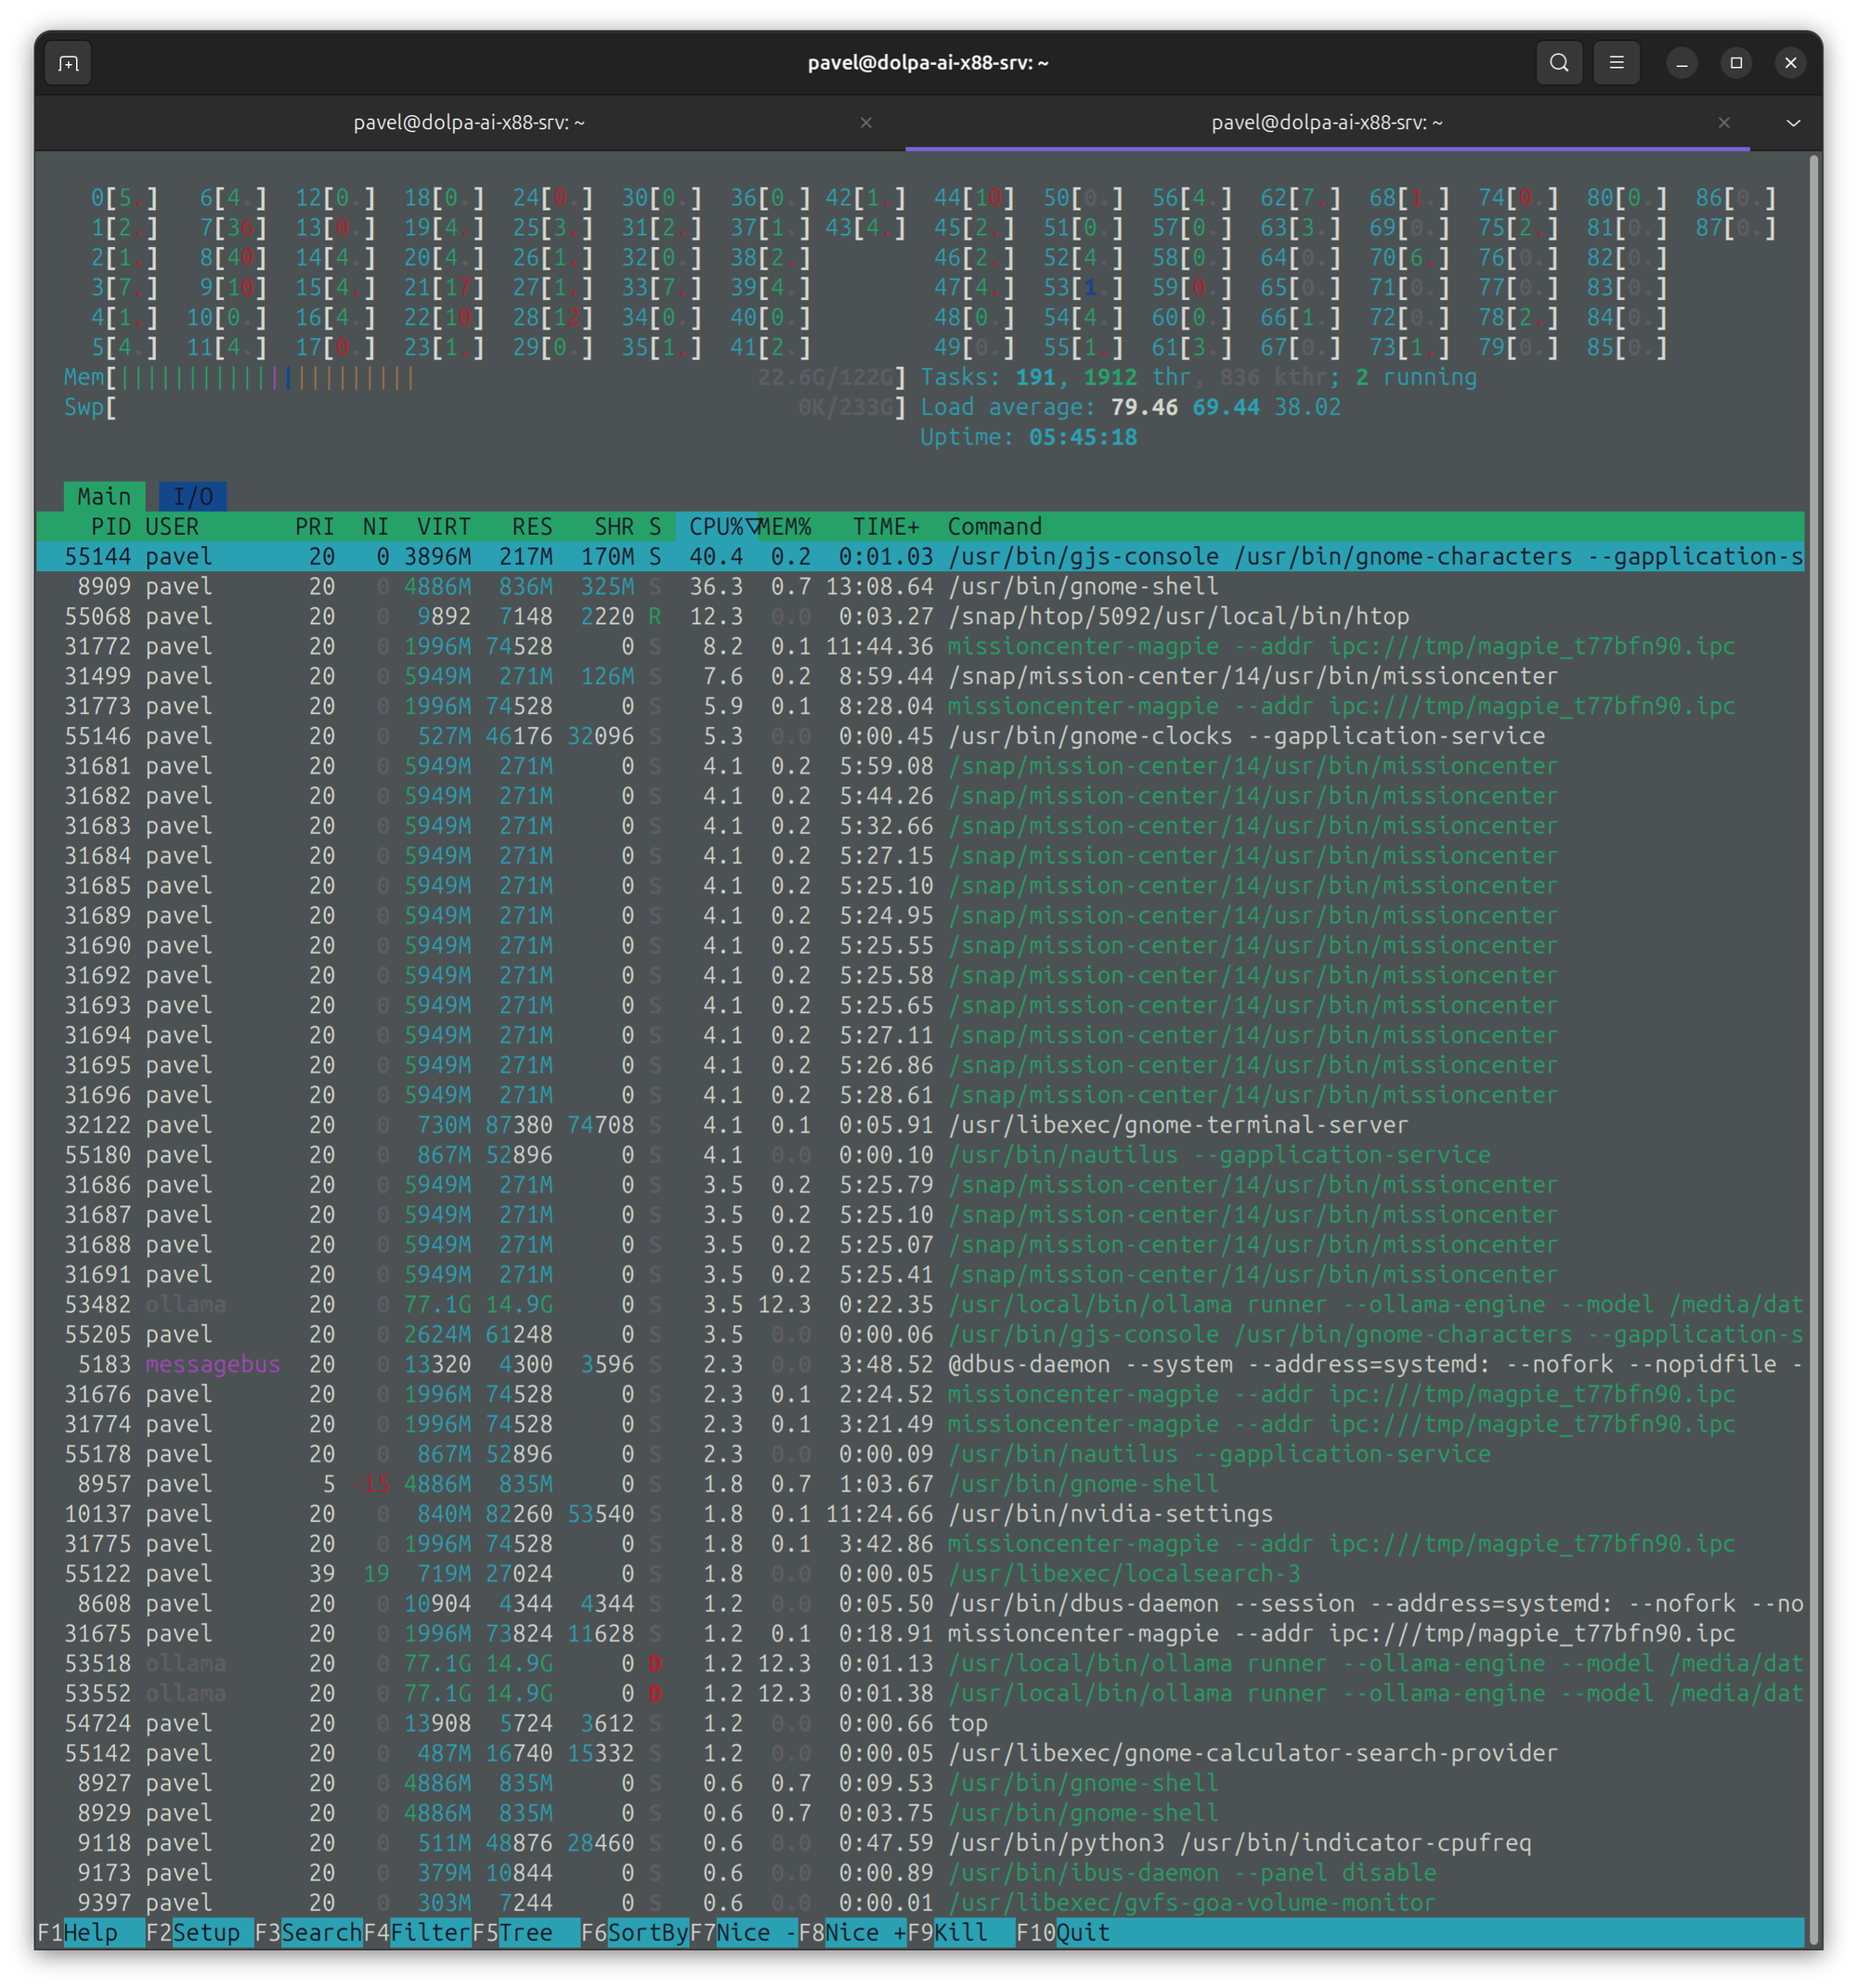
top and htop
2. Installation
htop is available in the repositories of virtually every Linux distribution. Choose the method that matches your OS.
2.1 Debian / Ubuntu / derivatives
sudo apt update
sudo apt install htop
Tip: On Ubuntu 22.04+ the package name is still htop. No extra repos required.2.2 Red Hat / CentOS / Fedora
# RHEL / CentOS 7 (EPEL repo)
sudo yum install epel-release
sudo yum install htop

# RHEL / CentOS 8 / Rocky / AlmaLinux (dnf)
sudo dnf install htop

# Fedora (latest)
sudo dnf install htop
2.3 Arch Linux & Manjaro
sudo pacman -Syu htop
2.4 macOS (Homebrew)
brew install htop
# On macOS you may need to grant permissions for htop to read process info:
sudo chmod +s $(which htop)   # optional, see the caveats printed by brew
2.5 Building from source
If you need the absolute latest version or want to compile with custom options:
# Prerequisites
sudo apt install libncursesw5-dev build-essential git   # Debian/Ubuntu
# Or: sudo dnf install ncurses-devel gcc make git

# Clone repo
git clone https://github.com/htop-dev/htop.git
cd htop

# Build
./autogen.sh && ./configure && make

# Install (optional, requires root)
sudo make install
The binary will be installed as /usr/local/bin/htop.
3. Starting htop
htop
- Run as normal user – you’ll see only processes you’re allowed to see.
- Run as root (
sudo htop) – you get a full system view, and you can send signals to any process.
Additional command‑line options (see man htop for the complete list):
| Option | Description |
|---|---|
-d <seconds> |
Set refresh delay (default 1.0 s). |
-C |
Start with a compact view (no bar graphs). |
-u <user> |
Show only processes owned by user. |
-p <pid1,pid2,…> |
Monitor only the listed PIDs. |
-s <field> |
Sort by field on start (e.g., -s MEM%). |
-t |
Enable tree view on start. |
-b |
Batch mode – non‑interactive output (good for scripts). |
-n |
No‑color mode (useful for logs). |
Example:
htop -d 0.5 -u root -s PERCENT_CPU
4. Understanding the Interface
When htop launches, the screen is divided into three main areas.
4.1 Header (Meters)
  1  [||||||||||||||||||||||||||||||||||||||||||||||||||||||||]  0.0%
  2  [||||||||||||||||||||||||||||||||||||||||||||||||||||||||]  0.0%
  3  [||||||||||||||||||||||||||||||||||||||||||||||||||||||||]  0.0%
  4  [||||||||||||||||||||||||||||||||||||||||||||||||||||||||]  0.0%
  Mem[|||||||||||||||||||||||||||||||||||||||]  2.31/7.79 GiB
  Swp[|||||||||||||]  0.00/2.00 GiB
  Load average: 0.15 0.07 0.03
- CPU meters: one per core (or combined if you select “CPU” as a single meter).
- Memory / Swap: visual bars with absolute usage shown.
- Load average: 1‑, 5‑, 15‑minute system load.
You can toggle which meters appear via F2 → Setup.
4.2 Process List (Columns)
| Column | Meaning | Typical Units |
|---|---|---|
PID |
Process ID | integer |
USER |
Owner | username |
PRI / NI |
Priority / Nice value | integer |
VIRT |
Virtual memory size | KiB/MiB/GiB |
RES |
Resident (physical) memory | KiB/MiB/GiB |
SHR |
Shared memory | KiB/MiB/GiB |
CPU% |
CPU usage (per‑core) | % |
MEM% |
Memory usage (percentage of RAM) | % |
TIME+ |
Cumulative CPU time | HH:MM:SS |
COMMAND |
Executable + arguments | string |
PID (tree view) |
Hierarchical indentation | – |
You can add or remove columns in the Setup menu (F2 → Columns) or via the F keys (see below).
4.3 Footer (Key hints)
At the bottom you’ll see a concise list of the most used keys, for example:
F1 Help F2 Setup F3 Search F4 Filter F5 Tree F6 SortBy F7 Nice- F8 Nice+ F9 Kill F10 Quit
These are always available, no matter which screen you are on.
5. Basic Navigation & Keyboard Shortcuts
| Key | Action |
|---|---|
| ↑ / ↓ | Move selection up/down one line |
| ← / → | Scroll horizontally (when columns exceed width) |
| PageUp / PageDown | Scroll a full screen |
| Home / End | Jump to top / bottom of the list |
| Enter | Expand/collapse a tree branch (if tree view enabled) |
| F1 | Open the built‑in help screen |
| F2 | Open Setup menu (configuration) |
| F3 | Search – type a string, Enter to jump, Esc to cancel |
| F4 | Filter – hide processes that don’t match the pattern |
| F5 | Toggle Tree view on/off |
| F6 | Choose Sort by column (interactive) |
| F7 | Decrease nice value (increase priority) for selected process |
| F8 | Increase nice value (decrease priority) |
| F9 | Kill – choose signal (SIGTERM, SIGKILL, etc.) |
| F10 | Quit htop |
| Space | Tag/untag a process (multiple selection) |
| s | Suspend (SIGSTOP) the selected process |
| r | Resume (SIGCONT) the selected process |
| c | Toggle display of command line vs program name |
| l | Toggle load average meter |
| m | Toggle memory meter |
| t | Toggle tree view (alternative to F5) |
| u | Show only processes belonging to a specific user |
| P | Show processes by PID (numeric filter) |
| Shift+F | Follow – lock view to a specific PID (useful for debugging) |
| ? | Show a quick cheat‑sheet (same as F1) |
Most of these keys work with the mouse as well: clicking column headers sorts, clicking a process selects it, right‑click opens a context menu (if compiled with mouse support).
6. Customising the Display
htop is designed to be tweaked on the fly without editing configuration files manually. All changes are persisted in ~/.config/htop/htoprc.
6.1 Adding/Removing Columns
- Press F2 → Columns.
- Use ← / → to move columns between Available and Active lists.
- Use ↑ / ↓ within the Active list to reorder.
- Press Enter to confirm, then Esc to exit.
Common useful columns:
| Column | Why add it? |
|---|---|
PERCENT_CPU |
Quick glance at which process hogs CPU |
PERCENT_MEM |
Spot memory hogs |
IO_RATE |
Show per‑process disk I/O (if kernel supports) |
TIME |
See cumulative CPU time |
COMMAND (full) |
Full command line for debugging |
STATE |
Process state (R, S, D, Z, etc.) |
USER |
Group processes by owner |
6.2 Changing Meters & Layout
- F2 → Setup.
Choose a layout: Left (vertical), Right, Top, Bottom, or Compact.
- Add/remove individual meters (CPU, Memory, Swap, Load, Uptime, Network, etc.).
- Drag them up/down to change order.
Example:
- Move Swap to the top‑right, hide Uptime, and enable Network (if you have
ifstatsupport).
6.3 Color Schemes & Themes
htop ships with several built‑in color palettes (e.g., default, monochrome, solarized).
- F2 → Appearance → Color Scheme – pick one.
- You can also edit
~/.config/htop/htoprcmanually to set custom RGB values (advanced).
6.4 Tree View & User‑Defined Filters
- Tree view (
F5ort) shows parent‑child relationships, making it easy to see which processes belong to a given service. - Filters (
F4) hide everything that does not match a regular expression. Example:F4→ typessh→ only ssh‑related processes stay visible. - Tagging (
Space) multiple processes lets you send a signal to all of them at once (F9→ choose signal).
7. Advanced Interaction
7.1 Searching & Filtering
- Search (
F3): incremental, case‑insensitive by default. PressEnterto jump to the next match,Escto abort. - Filter (
F4): works like a permanent search; you can clear it withF4again and an empty pattern.
Both accept regular expressions, so you can do sophisticated matches, e.g.:
F4 → ^(postgres|mysqld)
Shows only PostgreSQL or MySQL processes.
7.2 Killing, Renicing, and Tracing
| Action | Key | Typical use |
|---|---|---|
| Kill | F9 |
Choose SIGTERM, SIGKILL, etc. |
| Renice (increase priority) | F7 |
Decrease nice value (more CPU) |
| Renice (decrease priority) | F8 |
Increase nice value (less CPU) |
| Suspend | s |
Send SIGSTOP |
| Resume | r |
Send SIGCONT |
| Trace (strace) | t (when configured) |
Not built‑in; you can set a custom “command” in Setup → Options → Custom actions. |
Batch kill example:
- Tag several processes with Space.
- Press F9, select SIGTERM → all tagged processes receive the signal.
7.3 Monitoring Specific PIDs / Groups
- Use the “Follow” mode (Shift+F) while a process is selected to keep it centered as it moves up/down the list.
- Group by user: Press u, type a username, and
htopwill only show that user’s processes.
Start htop with -p to limit view:
htop -p 1234,5678
7.4 Using the “Setup” Menu (F2)
The Setup menu contains four tabs:
| Tab | What you can change |
|---|---|
| Meters | Add/remove meters, set layout, choose left/right/top/bottom. |
| Columns | Choose which columns appear and in what order. |
| Appearance | Color scheme, background, highlight style. |
| Options | Miscellaneous: hide userland threads, show program path, hide kernel threads, enable/disable mouse, set update delay, start in tree mode, etc. |
All changes are saved automatically when you leave the menu (Esc or F10).
8. Running htop in Batch Mode
Batch mode (-b) is non‑interactive and prints a snapshot (or a series of snapshots) to STDOUT. It is handy for scripts, monitoring tools, or logging.
# Single snapshot (default refresh interval = 1 sec)
htop -b -n -d 2 > /tmp/htop_snapshot.txt
-b→ batch mode.-n→ no colour (easier to parse).-d <seconds>→ delay between snapshots (if you use-Cfor continuous output).
Continuous logging example (10 snapshots, 5 s apart):
for i in {1..10}; do
    htop -b -n -d 5 >> /var/log/htop.log
    sleep 5
done
The output is a plain‑text table similar to top -b. You can pipe it to awk, grep, or sed for further analysis.
9. Saving & Loading Configurations
htop writes its configuration to:
$XDG_CONFIG_HOME/htop/htoprc
# or, if XDG not set:
~/.config/htop/htoprc
Exporting a configuration
cp ~/.config/htop/htoprc ~/my_htop_config.rc
Importing on another machine
mkdir -p ~/.config/htop
cp ~/my_htop_config.rc ~/.config/htop/htoprc
htop  # will start with the imported settings
If you maintain multiple profiles, you can keep several htoprc files and symlink the one you want before launching:
ln -sf ~/profiles/htop_server.rc ~/.config/htop/htoprc
htop
10. Common Issues & Troubleshooting
| Symptom | Possible cause | Fix |
|---|---|---|
| No columns fit the screen | Terminal width too small | Resize terminal, or press c to toggle short program names. |
| Mouse clicks do nothing | htop compiled without mouse support or mouse disabled in options. |
Press F2 → Options → Enable mouse. |
| Tree view shows no hierarchy | Kernel not providing PPID info (unlikely) or you are viewing a process that is a session leader. |
Verify with ps -ef that the processes have proper parent relationships. |
| Custom meters (e.g., network) missing | Required libraries (libncurses, libstatgrab) not present at compile time. |
Recompile htop with the appropriate dev packages (apt-get install libncurses5-dev libstatgrab-dev). |
| Batch mode prints “htop: failed to read /proc/… ” | Running as non‑root on a system with restricted /proc (e.g., containers). |
Run htop as root, or adjust /proc permissions if safe. |
| Colors look garbled | Terminal does not support 256‑color mode. | Switch to a monochrome or default scheme via F2 → Appearance. |
| Process list freezes | System under heavy load causing UI lag. | Increase update delay (F2 → Options → Delay), or use top for a lighter weight view. |
10. Quick Reference Cheat‑Sheet
F1  Help                F2  Setup
F3  Search              F4  Filter
F5  Tree view           F6  SortBy
F7  Decrease nice       F8  Increase nice
F9  Kill                F10 Quit
Space  Tag              s  Suspend
r  Resume               c  Toggle command line
u  Show user            t  Tree view
l  Load avg meter       m  Memory meter
11. Conclusion
htop is far more than a pretty replacement for top. Its interactive UI, tree view, tagging, filtering, customizable meters, and batch mode make it a powerful tool for both system administrators and developers. By mastering the keys listed above and exploring the Setup menu, you can adapt htop to virtually any monitoring workflow.
Happy monitoring! 🎛️